5 charts that show how productivity levels vary by state

Canva
5 charts that show how productivity levels vary by state
An assembly line worker installing a wheel on an orange bike.
The COVID-19 pandemic has driven an increase in productivity nationwide, even if that rise has been uneven from state to state.
ClickUp used data from the Bureau of Labor Statistics to compare productivity levels by state, based on business locations. The analysis looks closely at relationships between productivity, pay, and hours worked.
Economists and institutions have understood human beings as important elements in business operations since Adam Smith first proposed defining the concept of “human capital” in the late 1700s.
How many hours people work can be measured or estimated, and the total number of goods and services created in every hour of work per person is considered a measure of “productivity,” or the efficiency with which humans make new things in pursuit of economic gain.
Studies have shown since the 1950s that human capital, as much as money itself, can drive economic growth for entire nations of people.
Workers are, of course, much more than just an asset on a vehicle assembly line or an attendant on a commercial airplane—they are also individuals who have families, passions, and lives outside of the jobs they perform.
The COVID-19 pandemic laid bare Americans’ modern struggle to balance those two worlds. Working at home or in risky work environments, people discovered newfound leverage in an economy where workers were in high demand. Many workers began seeking more job flexibility and compensation or switched jobs.
As measured by economists today, productivity is a human force that has only ever increased. That’s because people incorporate new technology and innovation, allowing them to produce goods and services more efficiently. And the U.S. has been consistent in bringing about technological advancements over the last several decades. Whether the private sector has aptly leveraged them is a matter of debate.
Because of this fact, examining the change in productivity from year to year is more valuable than simply acknowledging the long-accepted trend that technological advancement has only caused humans to be more productive over time.
So just how much more value did workers create per hour in 2021 compared with 2020? Nationwide, labor productivity among private sector workers increased by 1.9% in 2021, or about on par with the last several decades. According to the BLS, hours worked grew 5.4% from 2020 to 2021—the most significant year-to-year growth in decades, though the 2021 figures still did not exceed the total hours worked in 2019.
That’s partly due to 2020 being a historically disruptive year for work. The spreading contagion and a lack of vaccines to prevent death meant in-person business operations were dangerous and even potentially deadly, especially for older workers.
![]()
ClickUp
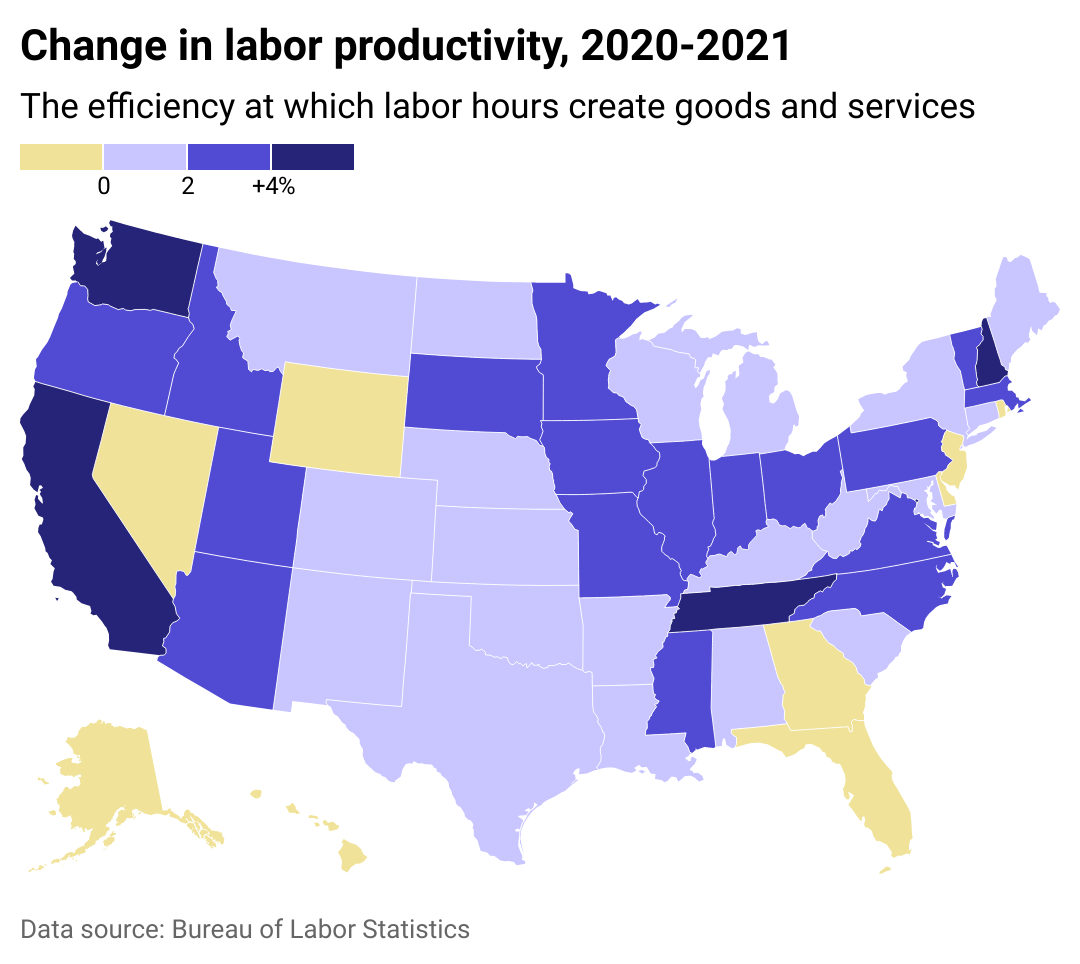
Most states increased labor productivity, but a few saw decreases
A heat map showing the percent change in labor productivity from 2020 to 2021. Most states saw an increase, but a few saw decreases.
Areas that are home to fast-growing businesses can be evidence of more rapid productivity growth, according to the Brookings Institute. This information could help explain why California and Washington, home to much of the country’s tech presence, saw significant increases in productivity over the first two years of the COVID-19 pandemic.
States not traditionally viewed as tech hubs also benefited from dramatic swings in domestic migration that saw urban-dwelling white-collar Americans moving from the crowded, expensive coasts to more affordable states. Tennessee has seen its tech sector blossom in recent years—a trend bolstered by pandemic pressures.
ClickUp
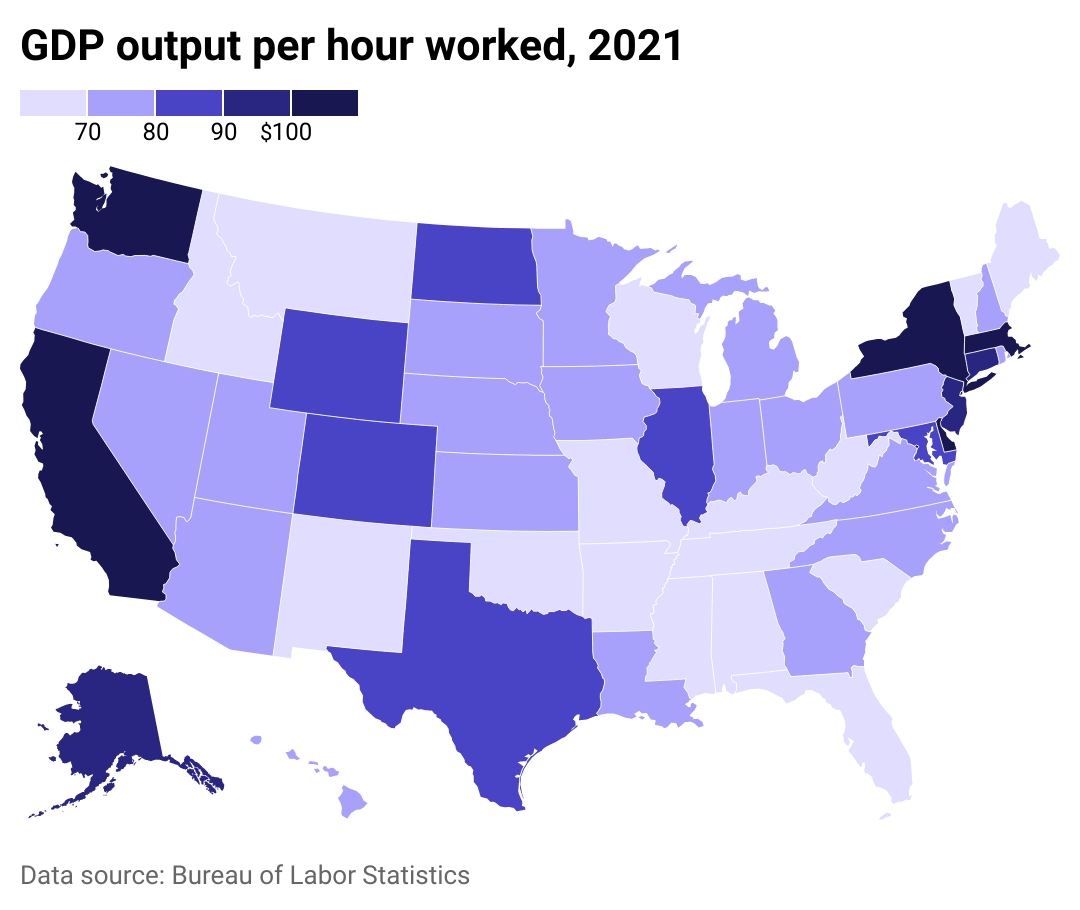
GDP contributions ranged from $58 to $118 per hour
A heat map showing the difference in monetary value to an hour’s work in each state, measured as value-added output.
The booming economies of California, New York, Massachusetts, and Washington saw workers creating the most value per hour worked. These are states with widespread internet availability that allows for leveraging the latest technological developments in software, as well as burgeoning populations.
The Midwest has trailed all other regions of the country since 2007 in terms of productivity gains, according to BLS analysis.
ClickUp
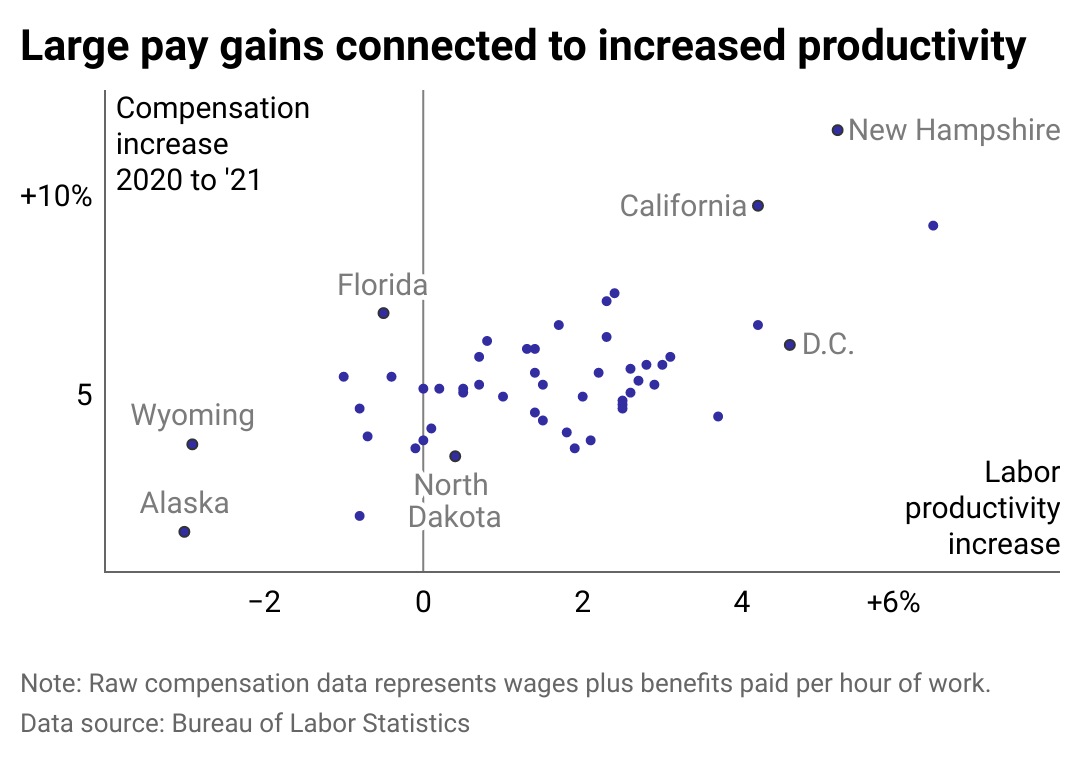
Productivity grew most where compensation surged
A scatter plot juxtaposing the change in hourly compensation vs the change in productivity. Higher increases in compensation correlate with higher labor productivity.
There is a strong correlation between increased pay and increases in productivity. Researchers have found that companies that raise pay, including in response to minimum-wage increases, create a greater sense of attachment between workers and the employer.
California, New Hampshire, and Washington D.C., all saw compensation rise more than 5% in 2021 over 2020 levels. Those places also have some of the highest living costs in the nation. Florida, home to a large aging population, also saw significant wage gains relative to other states, but those did not translate to increases in productivity.
ClickUp
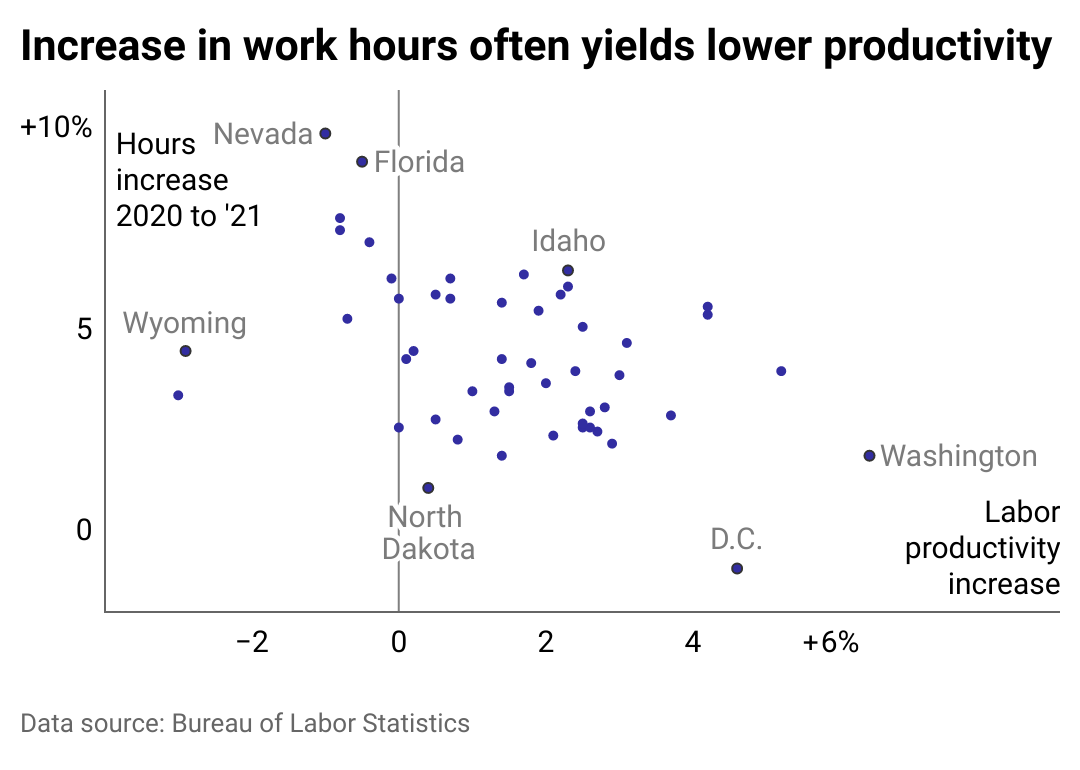
That trend didn’t hold true for increasing hours
A scatter plot juxtaposing the change in hours worked vs the change in productivity. There is a loose correlation between an increase in hours worked and decrease in labor productivity, and vice versa.
Working longer hours doesn’t necessarily mean producing more value for a firm, an employee, or the economy. Numbers bear this out: Workers in states including Nevada, Wyoming, and Florida spent longer hours working and actually saw a decline in productivity as a result.
In Washington and Washington D.C., workers made strides in efficiency, seeing 4% or more year-over-year growth in productivity, according to BLS data.
Some white-collar workers found the shift to remote work during the pandemic meant more hours working because their personal smartphones could receive work communications long after the official eight-hour workday ended. The majority, however, have said it helped them find a better work-life balance, according to a Pew Research poll conducted in January 2022.
ClickUp
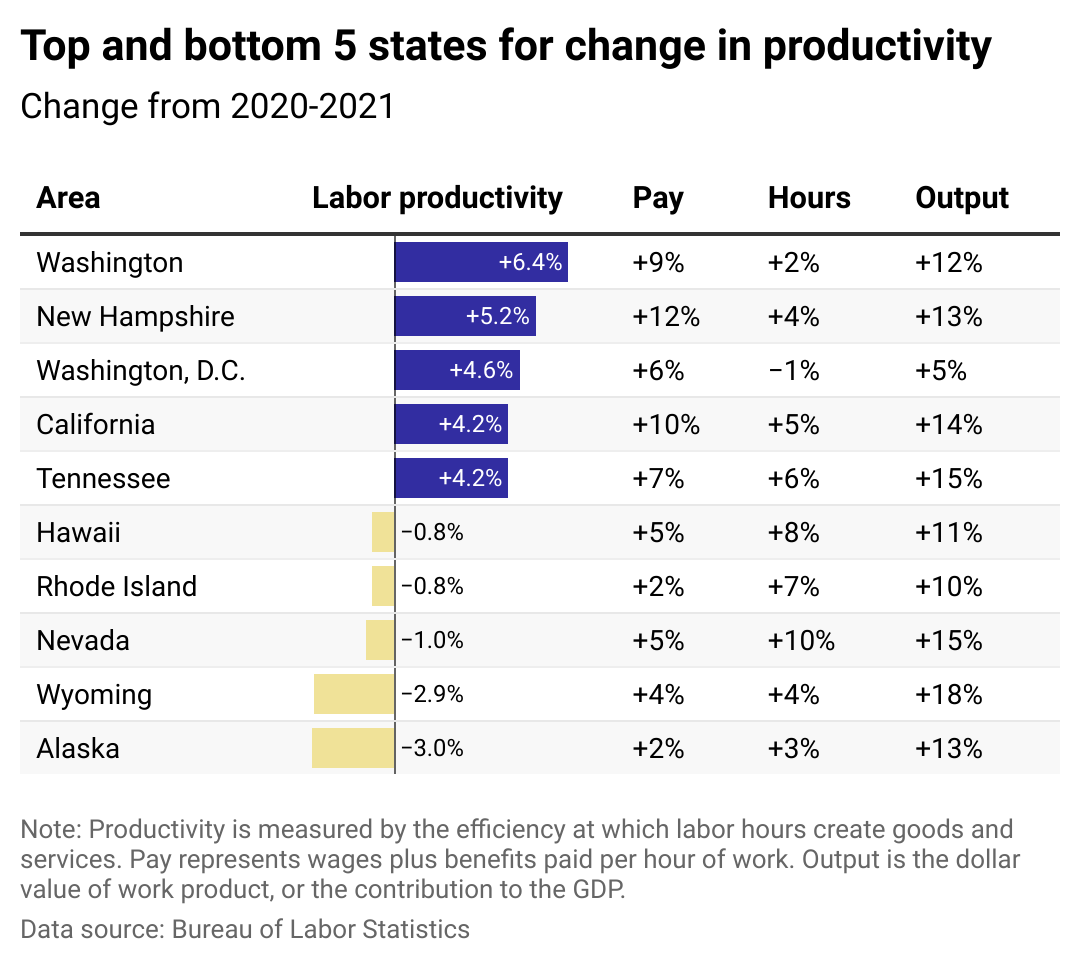
Rounding up the top and bottom performers
A table including a bar chart with the top and bottom five states by productivity growth/decline, and the annual change in pay, hours, and GDP output for each.
The bottom line is that worker output increased over the year as demand skyrocketed for goods while Americans continued to avoid service industry businesses like live events and Nevada’s casinos.
Some state economies were in a better position to benefit from that shift in demand. States like Wyoming and Alaska, however, saw productivity suffer. They also saw wages that, despite increasing, trailed growth rates in states with highly skilled workforces like New Hampshire and Washington.
This story originally appeared on ClickUp and was produced and
distributed in partnership with Stacker Studio.