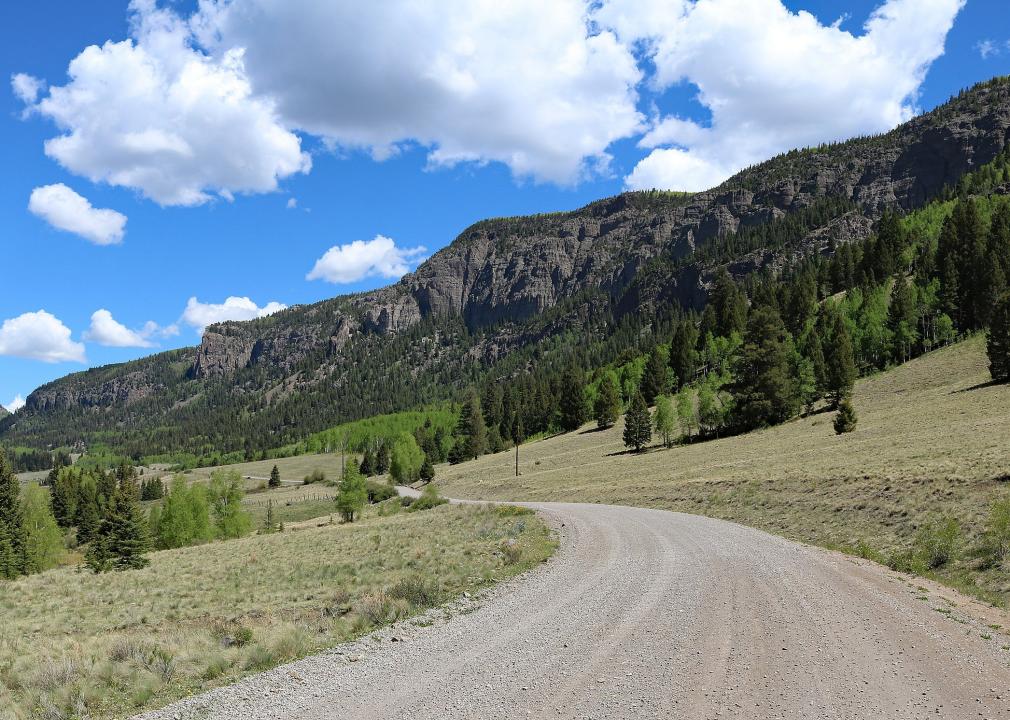
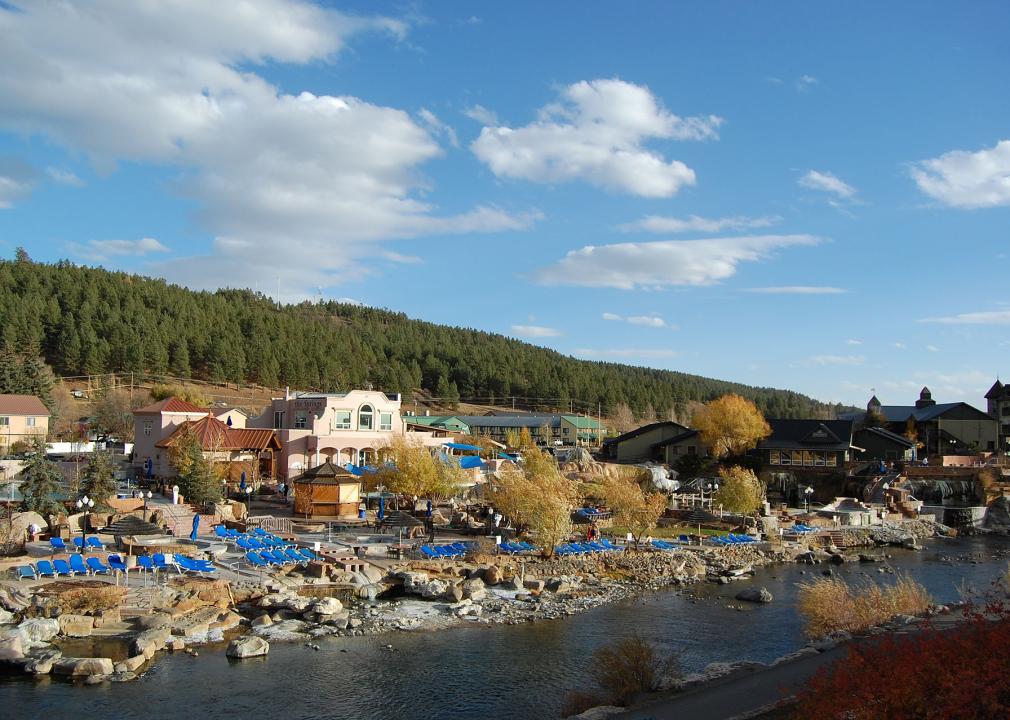
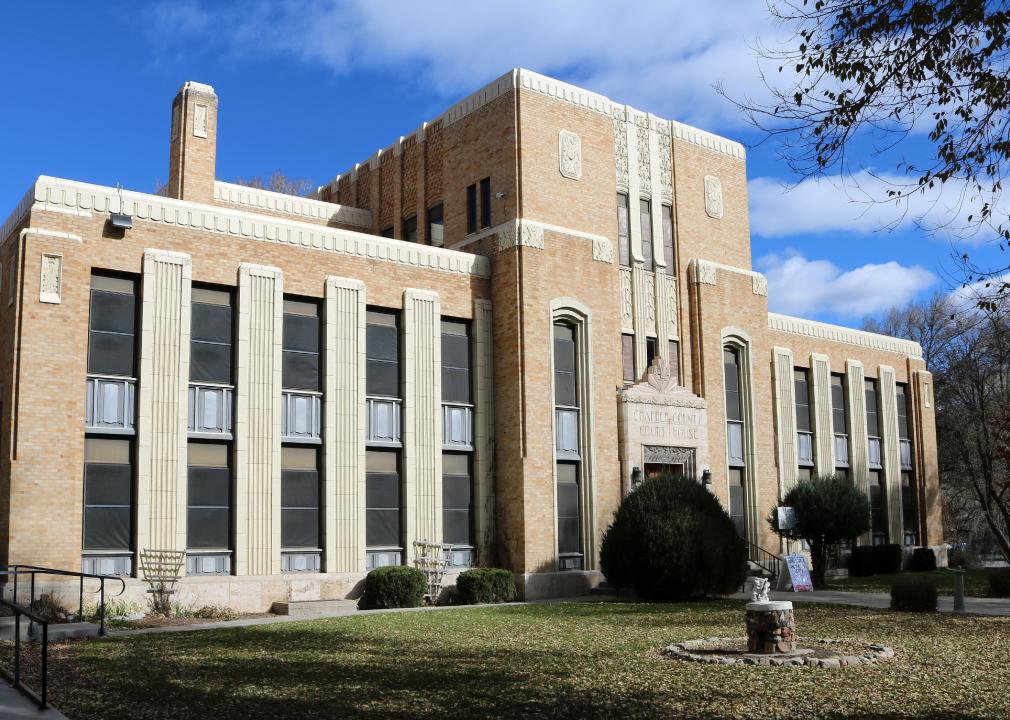
Counties with the most super commuters in Colorado

Wusel007 // Wikimedia Commons
Counties with the most super commuters in Colorado
There are more than 283 million vehicles on the road in the United States, and many of those cars, trucks, vans, and motorcycles are used to ferry people to and from their homes and jobs during their daily commutes. A small but growing number of people are walking and biking to work, particularly in compact college towns. Many more take public transportation, especially in major cities like New York, Chicago, San Francisco, Washington D.C., Boston, and Seattle—but nationwide, public transit accounts for only about 5% of daily commutes.
The overwhelming majority of people still drive to and from work every day, and the vast majority of those car commuters drive alone—fewer than 10% of Americans carpool. According to the U.S. Census Bureau, the average one-way commute in the United States has grown to a record 26.9 minutes. That’s just shy of an hour a day that average Americans squander behind the wheel, not at home with their families, and instead, burning gas and putting miles on their cars.
For some Americans, however, the commute to work is far from average. A phenomenon known as super commuting has emerged and grown in recent years. Super commuters spend 90 minutes or more—each way—chasing their paychecks every day. The biggest percentage of super commuters work in the extraction industry, with workers pursuing lucrative jobs in remote mines, oil fields, and other energy operations. Many more, however, have been priced out of expensive housing in urban metro areas where high-paying jobs are located, far away from their less-expensive county of residence.
Stacker compiled a list of counties with the most super commuters in Colorado using data from the U.S. Census Bureau. Counties are ranked by the highest percent of workers with a commute over 90 minutes, based on 2020 5-year estimates. Keep reading to see where in your state people are spending the most time going to and from work every day.
You may also like: Cities with the most expensive homes in Colorado
![]()
The Greater Southwestern Exploration Company from Long Beach, California, United States // Wikimedia Commons
#50. Gunnison County
– Workers with 90+ minute commute: 1.2%
— 60+ minute commute: 2.3%
– Average commute time: 15.4 minutes
— 10.4 minutes shorter than state average
– Left for work from 12 a.m. to 6 a.m.: 8.4%
– Worked outside county of residence: 4.9%
– Means of transportation: drove alone (58.0%), carpooled (12.5%), walked to work (15.2%), public transportation (5.3%), worked from home (5.7%)
Jeffrey Beall // Wikimedia Commons
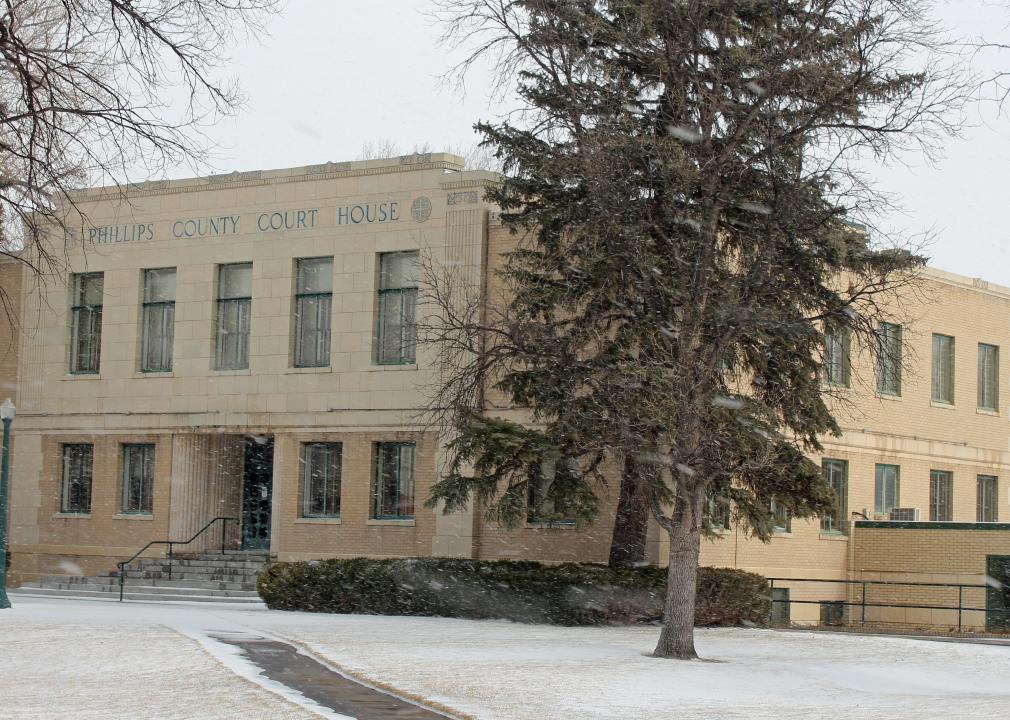
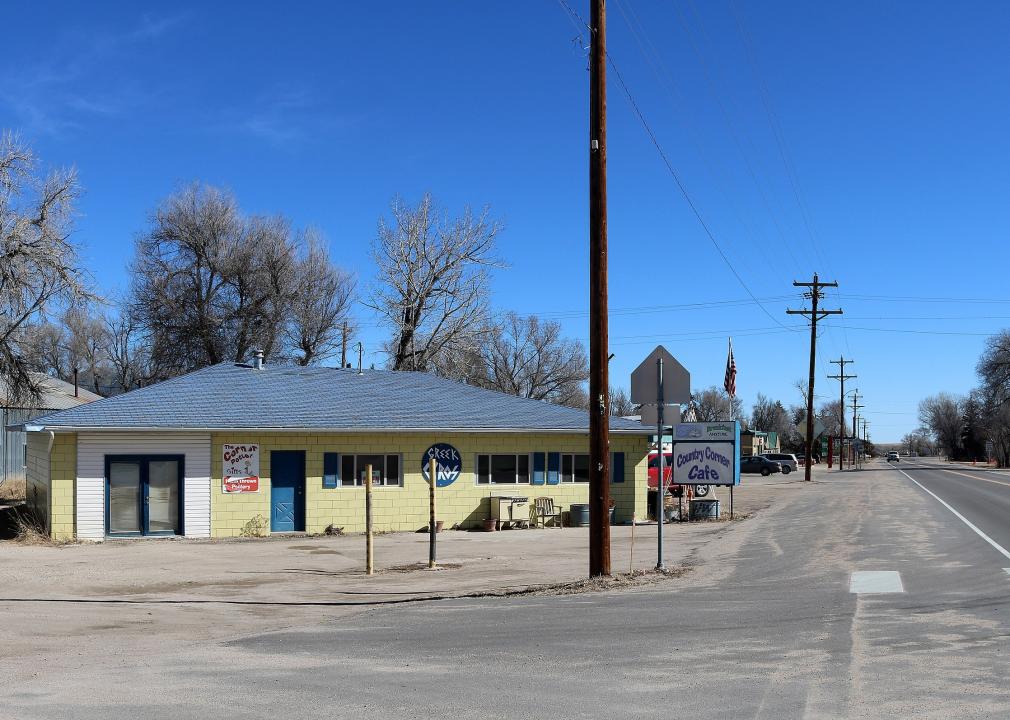
#49. Phillips County
– Workers with 90+ minute commute: 1.4%
— 60+ minute commute: 3.0%
– Average commute time: 16.3 minutes
— 9.5 minutes shorter than state average
– Left for work from 12 a.m. to 6 a.m.: 20.9%
– Worked outside county of residence: 19.4%
– Means of transportation: drove alone (71.9%), carpooled (17.5%), walked to work (5.0%), public transportation (0.0%), worked from home (5.2%)
Maciej Bledowski // Shutterstock
#48. Boulder County
– Workers with 90+ minute commute: 1.4%
— 60+ minute commute: 6.2%
– Average commute time: 23.5 minutes
— 2.3 minutes shorter than state average
– Left for work from 12 a.m. to 6 a.m.: 7.8%
– Worked outside county of residence: 18.7%
– Means of transportation: drove alone (62.7%), carpooled (7.0%), walked to work (4.6%), public transportation (4.8%), worked from home (16.1%)
RandieCraft // Wikimedia Commons
#47. Moffat County
– Workers with 90+ minute commute: 1.4%
— 60+ minute commute: 15.6%
– Average commute time: 25.2 minutes
— 0.6 minutes shorter than state average
– Left for work from 12 a.m. to 6 a.m.: 18.4%
– Worked outside county of residence: 35.6%
– Means of transportation: drove alone (72.7%), carpooled (21.4%), walked to work (1.6%), public transportation (0.5%), worked from home (3.2%)
Jeffrey Beall // Wikimedia Commons
#46. Conejos County
– Workers with 90+ minute commute: 1.4%
— 60+ minute commute: 2.2%
– Average commute time: 24.4 minutes
— 1.4 minutes shorter than state average
– Left for work from 12 a.m. to 6 a.m.: 8.8%
– Worked outside county of residence: 41.3%
– Means of transportation: drove alone (68.0%), carpooled (17.5%), walked to work (2.0%), public transportation (0.0%), worked from home (11.4%)
You may also like: Most popular girl names in the 80s in Colorado
f11photo // Shutterstock
#45. Denver
– Workers with 90+ minute commute: 1.5%
— 60+ minute commute: 5.3%
– Average commute time: 25.7 minutes
— 0.1 minutes shorter than state average
– Left for work from 12 a.m. to 6 a.m.: 10.3%
– Worked outside county of residence: 34.4%
– Means of transportation: drove alone (66.1%), carpooled (7.3%), walked to work (4.7%), public transportation (6.2%), worked from home (12.4%)
Canva
#44. Summit County
– Workers with 90+ minute commute: 1.5%
— 60+ minute commute: 4.8%
– Average commute time: 18.5 minutes
— 7.3 minutes shorter than state average
– Left for work from 12 a.m. to 6 a.m.: 10.7%
– Worked outside county of residence: 4.0%
– Means of transportation: drove alone (66.6%), carpooled (5.5%), walked to work (6.2%), public transportation (7.6%), worked from home (12.6%)
Canva
#43. Routt County
– Workers with 90+ minute commute: 1.6%
— 60+ minute commute: 3.3%
– Average commute time: 19.2 minutes
— 6.6 minutes shorter than state average
– Left for work from 12 a.m. to 6 a.m.: 8.3%
– Worked outside county of residence: 3.2%
– Means of transportation: drove alone (68.2%), carpooled (7.7%), walked to work (3.8%), public transportation (2.9%), worked from home (12.5%)
Canva
#42. La Plata County
– Workers with 90+ minute commute: 1.6%
— 60+ minute commute: 4.5%
– Average commute time: 21.7 minutes
— 4.1 minutes shorter than state average
– Left for work from 12 a.m. to 6 a.m.: 10.2%
– Worked outside county of residence: 2.2%
– Means of transportation: drove alone (71.3%), carpooled (7.2%), walked to work (5.2%), public transportation (0.8%), worked from home (11.8%)
Yassie // Wikimedia Commons
#41. Jefferson County
– Workers with 90+ minute commute: 1.6%
— 60+ minute commute: 7.5%
– Average commute time: 27.8 minutes
— 2.0 minutes longer than state average
– Left for work from 12 a.m. to 6 a.m.: 12.4%
– Worked outside county of residence: 46.4%
– Means of transportation: drove alone (75.1%), carpooled (6.8%), walked to work (1.5%), public transportation (2.9%), worked from home (12.2%)
You may also like: Counties most concerned about climate change in Colorado
Billy Hathorn // Wikimedia Commons
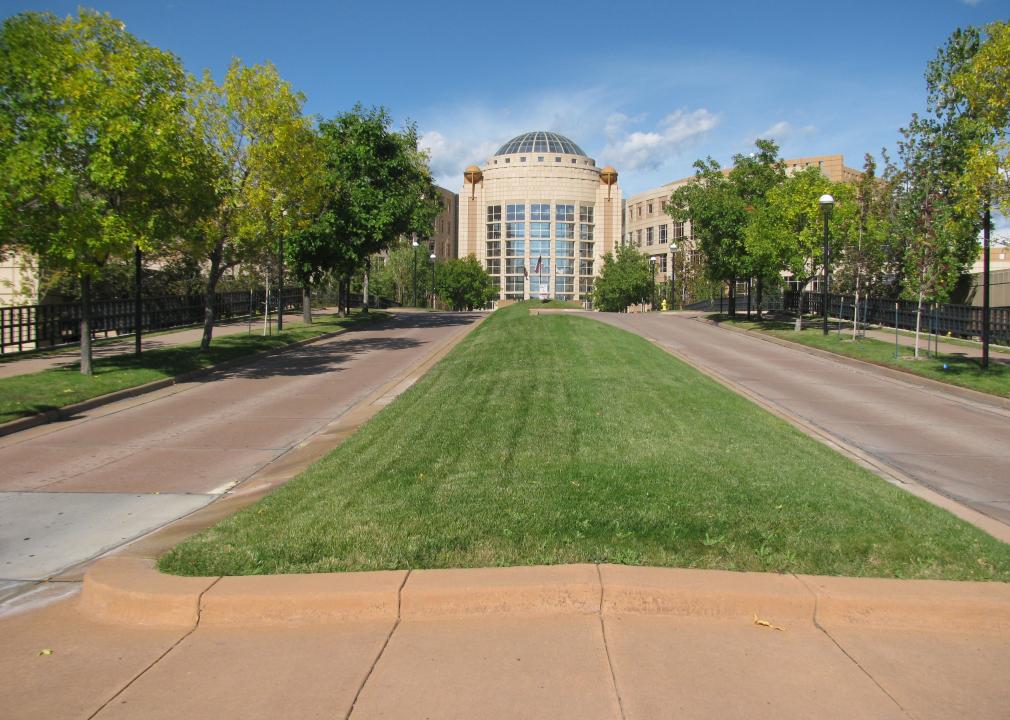
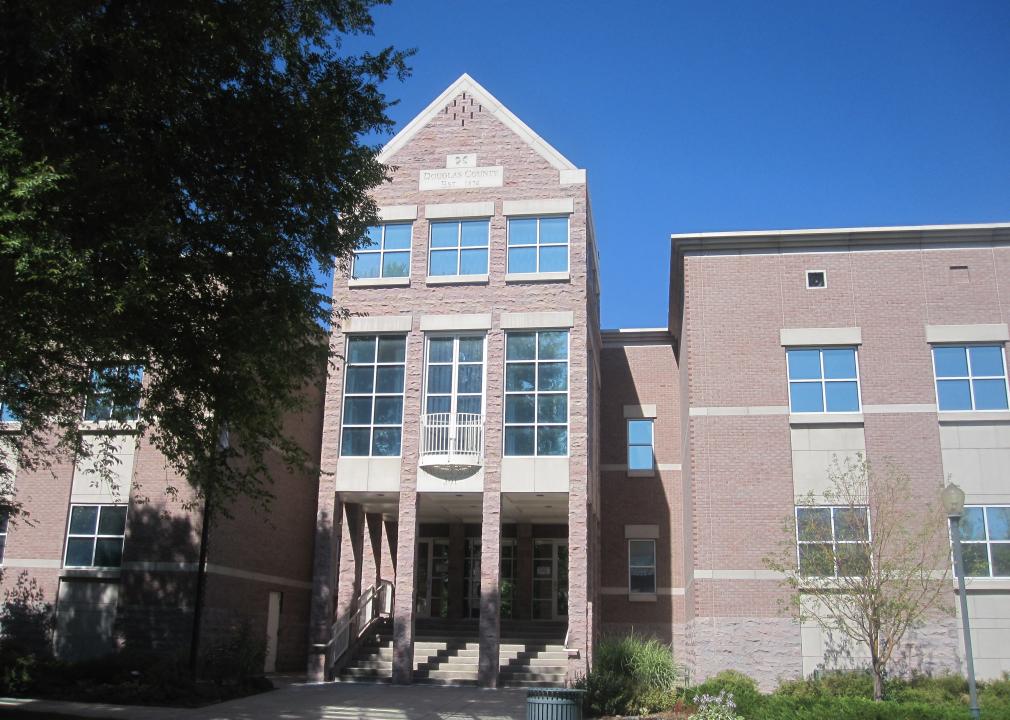
#40. Douglas County
– Workers with 90+ minute commute: 1.8%
— 60+ minute commute: 7.5%
– Average commute time: 27.7 minutes
— 1.9 minutes longer than state average
– Left for work from 12 a.m. to 6 a.m.: 10.7%
– Worked outside county of residence: 48.1%
– Means of transportation: drove alone (74.1%), carpooled (5.9%), walked to work (1.3%), public transportation (1.6%), worked from home (16.0%)
Jeffrey Beall // Wikimedia Commons
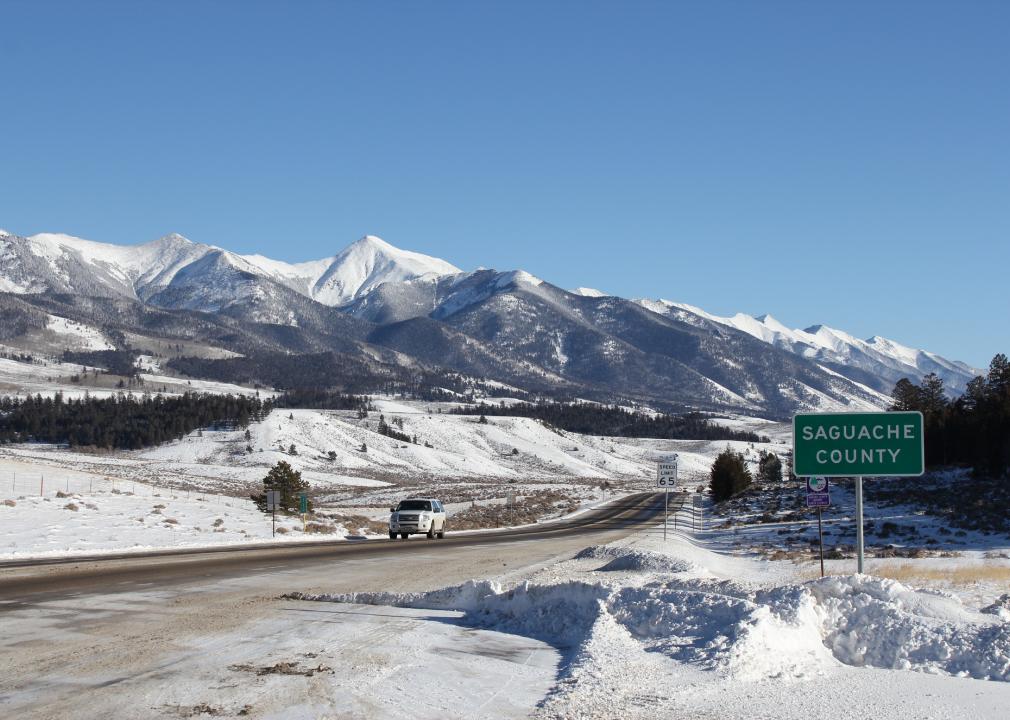
#39. Saguache County
– Workers with 90+ minute commute: 2.0%
— 60+ minute commute: 4.6%
– Average commute time: 21.4 minutes
— 4.4 minutes shorter than state average
– Left for work from 12 a.m. to 6 a.m.: 9.5%
– Worked outside county of residence: 29.8%
– Means of transportation: drove alone (65.7%), carpooled (14.8%), walked to work (4.6%), public transportation (0.4%), worked from home (13.9%)

Jeffrey Beall // Wikimedia Commons
#38. Huerfano County
– Workers with 90+ minute commute: 2.1%
— 60+ minute commute: 7.7%
– Average commute time: 20.5 minutes
— 5.3 minutes shorter than state average
– Left for work from 12 a.m. to 6 a.m.: 12.5%
– Worked outside county of residence: 9.3%
– Means of transportation: drove alone (69.4%), carpooled (5.8%), walked to work (5.5%), public transportation (0.2%), worked from home (17.9%)
Mountain Mike Johans // Wikimedia Commons
#37. Arapahoe County
– Workers with 90+ minute commute: 2.1%
— 60+ minute commute: 7.7%
– Average commute time: 28.2 minutes
— 2.4 minutes longer than state average
– Left for work from 12 a.m. to 6 a.m.: 13.5%
– Worked outside county of residence: 47.5%
– Means of transportation: drove alone (74.7%), carpooled (8.7%), walked to work (1.5%), public transportation (3.6%), worked from home (10.0%)
Bdearthco // Wikimedia Commons
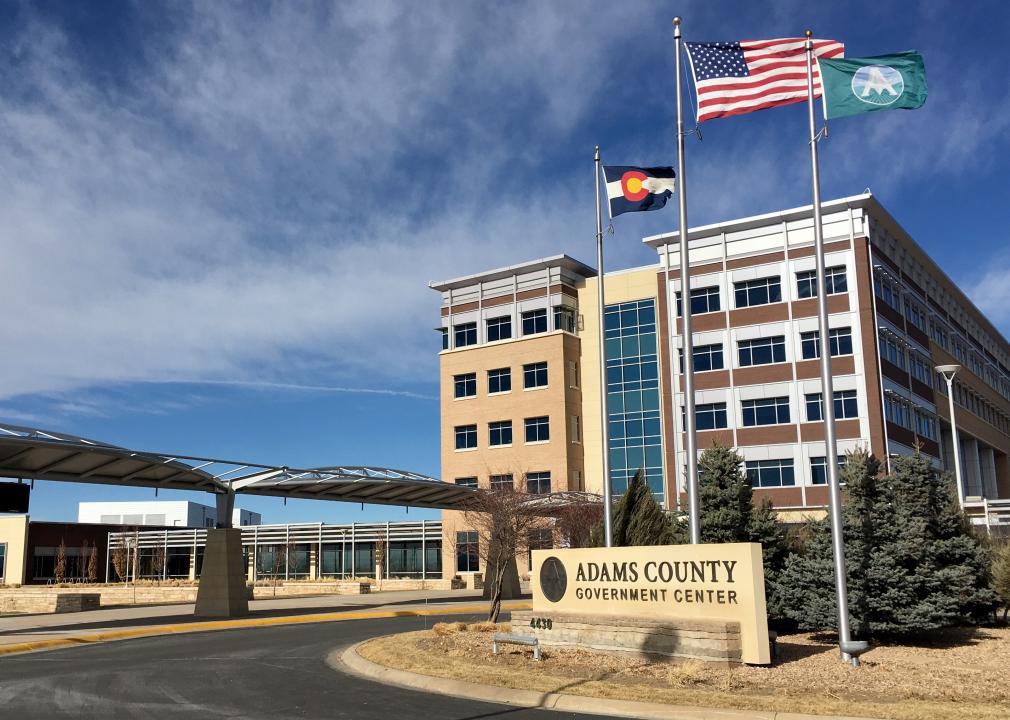
#36. Adams County
– Workers with 90+ minute commute: 2.1%
— 60+ minute commute: 9.5%
– Average commute time: 29.8 minutes
— 4.0 minutes longer than state average
– Left for work from 12 a.m. to 6 a.m.: 19.1%
– Worked outside county of residence: 57.6%
– Means of transportation: drove alone (76.1%), carpooled (10.9%), walked to work (1.2%), public transportation (3.4%), worked from home (7.2%)
You may also like: Recipes from Colorado
Eleaf // Wikimedia Commons
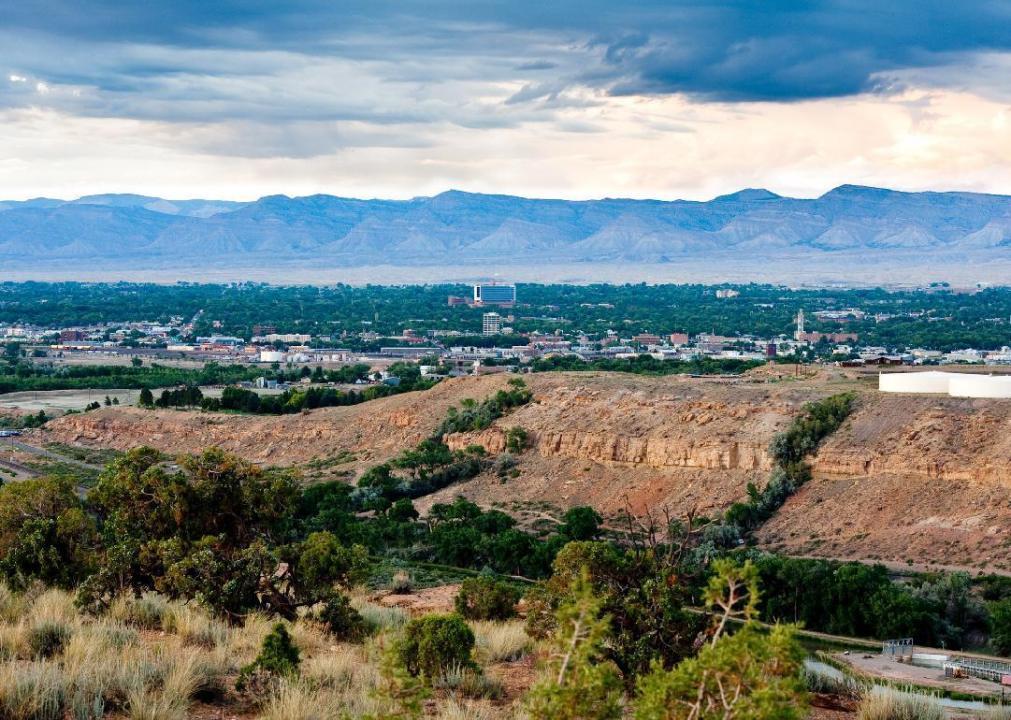
#35. Mesa County
– Workers with 90+ minute commute: 2.1%
— 60+ minute commute: 4.4%
– Average commute time: 18.9 minutes
— 6.9 minutes shorter than state average
– Left for work from 12 a.m. to 6 a.m.: 12.3%
– Worked outside county of residence: 3.8%
– Means of transportation: drove alone (77.0%), carpooled (8.3%), walked to work (3.1%), public transportation (0.5%), worked from home (8.2%)
Citycommunications // Wikicommons
#34. Larimer County
– Workers with 90+ minute commute: 2.1%
— 60+ minute commute: 7.1%
– Average commute time: 23.6 minutes
— 2.2 minutes shorter than state average
– Left for work from 12 a.m. to 6 a.m.: 12.2%
– Worked outside county of residence: 14.8%
– Means of transportation: drove alone (73.0%), carpooled (7.3%), walked to work (2.8%), public transportation (1.4%), worked from home (11.7%)
Jeffrey Beall // Wikimedia Commons
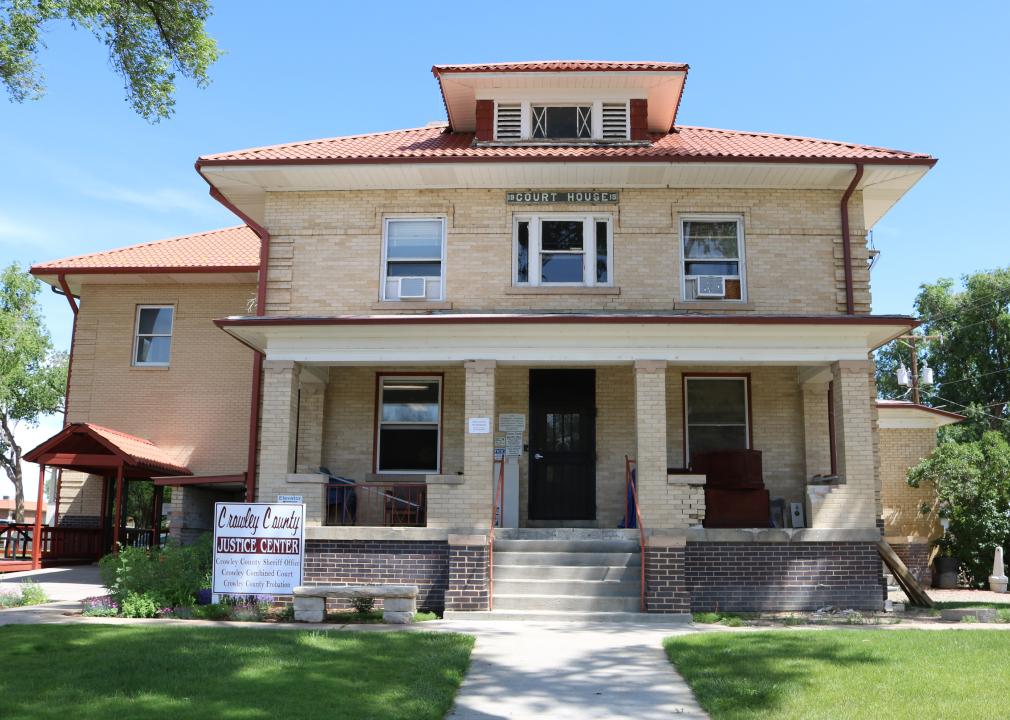
#33. Crowley County
– Workers with 90+ minute commute: 2.1%
— 60+ minute commute: 8.4%
– Average commute time: 21.3 minutes
— 4.5 minutes shorter than state average
– Left for work from 12 a.m. to 6 a.m.: 11.2%
– Worked outside county of residence: 50.4%
– Means of transportation: drove alone (78.2%), carpooled (10.1%), walked to work (2.8%), public transportation (0.2%), worked from home (8.4%)
Aualliso // Wikimedia Commons
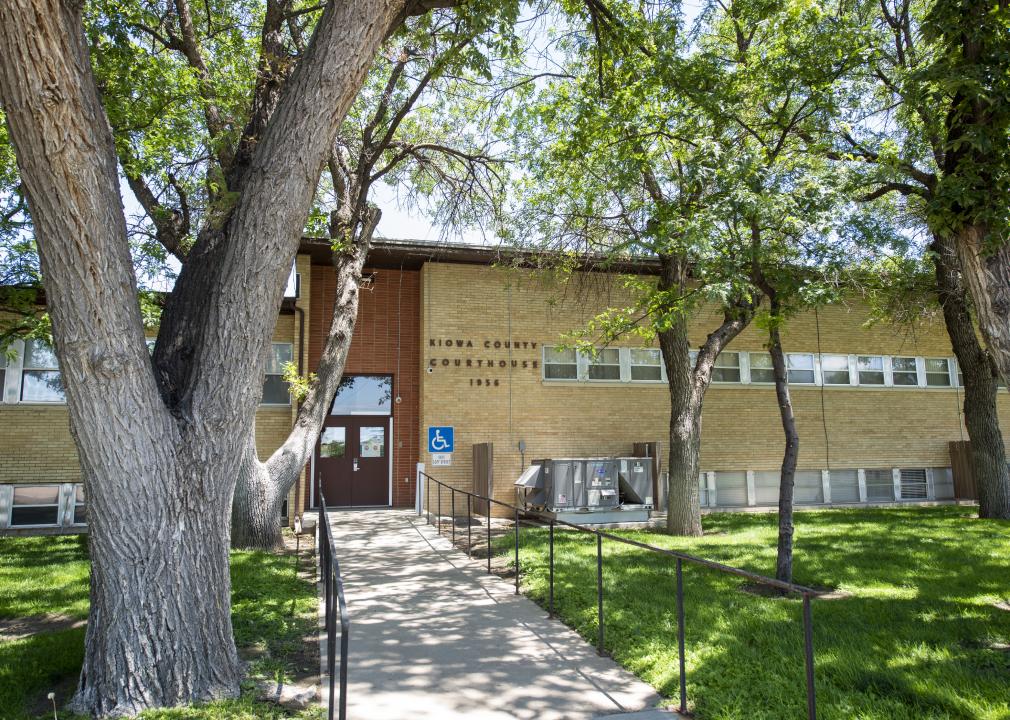
#32. Kiowa County
– Workers with 90+ minute commute: 2.2%
— 60+ minute commute: 3.1%
– Average commute time: 15 minutes
— 10.8 minutes shorter than state average
– Left for work from 12 a.m. to 6 a.m.: 9.5%
– Worked outside county of residence: 14.4%
– Means of transportation: drove alone (80.2%), carpooled (6.5%), walked to work (5.9%), public transportation (0.0%), worked from home (3.8%)
Aualliso // Wikimedia Commons
#31. Prowers County
– Workers with 90+ minute commute: 2.3%
— 60+ minute commute: 4.7%
– Average commute time: 16.7 minutes
— 9.1 minutes shorter than state average
– Left for work from 12 a.m. to 6 a.m.: 17.7%
– Worked outside county of residence: 8.5%
– Means of transportation: drove alone (84.0%), carpooled (6.5%), walked to work (1.4%), public transportation (0.0%), worked from home (5.5%)
You may also like: Counties with the highest rate of food insecurity in Colorado

Peter Romero // Wikimedia Commons
#30. Weld County
– Workers with 90+ minute commute: 2.3%
— 60+ minute commute: 10.6%
– Average commute time: 27.9 minutes
— 2.1 minutes longer than state average
– Left for work from 12 a.m. to 6 a.m.: 20.4%
– Worked outside county of residence: 39.1%
– Means of transportation: drove alone (78.4%), carpooled (10.4%), walked to work (2.0%), public transportation (0.4%), worked from home (7.5%)

Robert Corby // Wikimedia Commons
#29. El Paso County
– Workers with 90+ minute commute: 2.4%
— 60+ minute commute: 5.7%
– Average commute time: 23.9 minutes
— 1.9 minutes shorter than state average
– Left for work from 12 a.m. to 6 a.m.: 13.8%
– Worked outside county of residence: 5.5%
– Means of transportation: drove alone (75.2%), carpooled (10.2%), walked to work (3.4%), public transportation (0.7%), worked from home (9.1%)
Jeffrey Beall // Wikimedia Commons
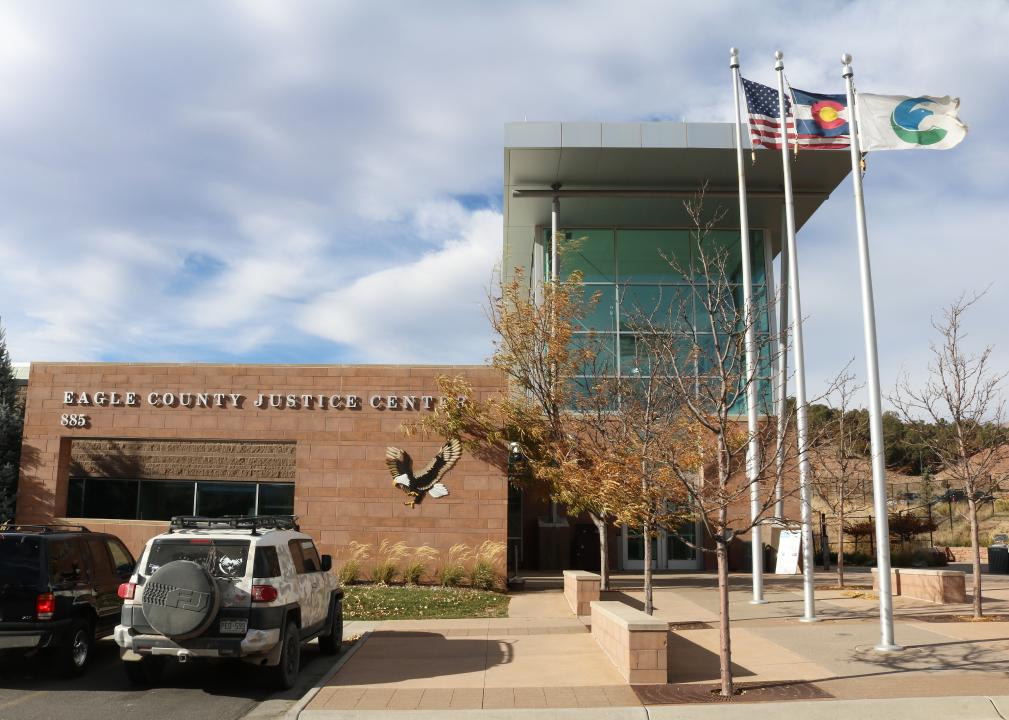
#28. Eagle County
– Workers with 90+ minute commute: 2.5%
— 60+ minute commute: 5.4%
– Average commute time: 23.3 minutes
— 2.5 minutes shorter than state average
– Left for work from 12 a.m. to 6 a.m.: 7.7%
– Worked outside county of residence: 15.6%
– Means of transportation: drove alone (73.7%), carpooled (5.8%), walked to work (3.1%), public transportation (3.2%), worked from home (11.8%)
Thomson200 // Wikimedia Commons
#27. Park County
– Workers with 90+ minute commute: 2.5%
— 60+ minute commute: 20.6%
– Average commute time: 37.9 minutes
— 12.1 minutes longer than state average
– Left for work from 12 a.m. to 6 a.m.: 19.9%
– Worked outside county of residence: 56.0%
– Means of transportation: drove alone (69.5%), carpooled (11.3%), walked to work (1.3%), public transportation (0.5%), worked from home (15.4%)
Jeffrey Beall // Wikimedia Commons
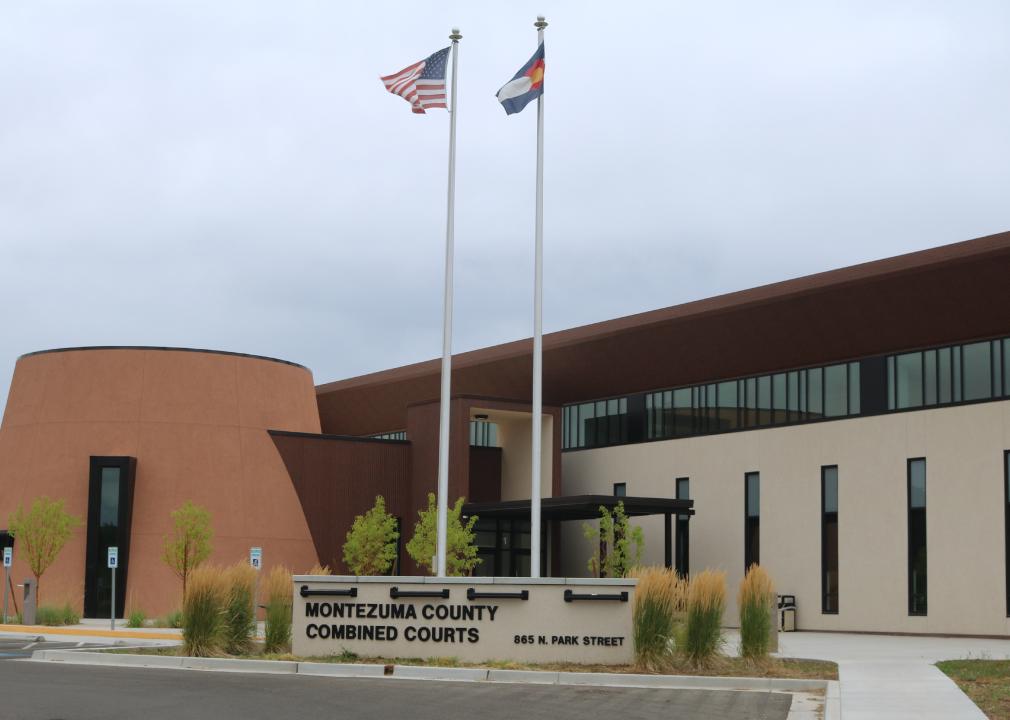
#26. Montezuma County
– Workers with 90+ minute commute: 2.6%
— 60+ minute commute: 7.2%
– Average commute time: 20.1 minutes
— 5.7 minutes shorter than state average
– Left for work from 12 a.m. to 6 a.m.: 10.7%
– Worked outside county of residence: 7.8%
– Means of transportation: drove alone (78.9%), carpooled (8.4%), walked to work (4.2%), public transportation (0.1%), worked from home (6.6%)
You may also like: Highest-earning counties in Colorado
John Wark // Wikicommons
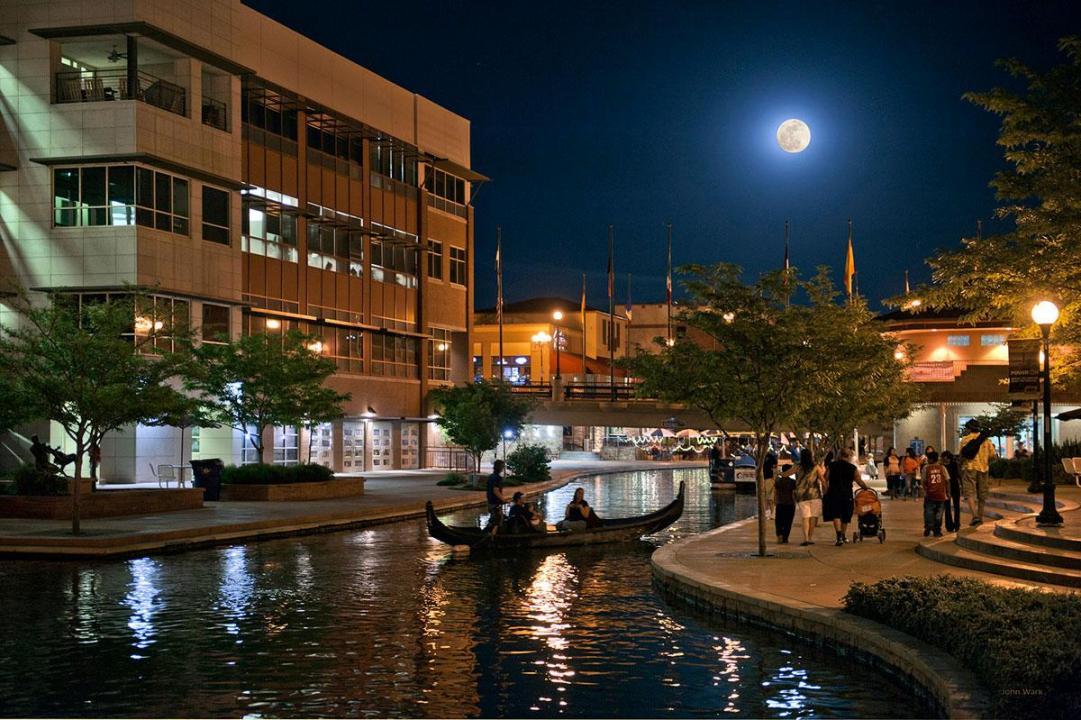
#25. Pueblo County
– Workers with 90+ minute commute: 2.6%
— 60+ minute commute: 6.3%
– Average commute time: 22.2 minutes
— 3.6 minutes shorter than state average
– Left for work from 12 a.m. to 6 a.m.: 16.8%
– Worked outside county of residence: 10.9%
– Means of transportation: drove alone (81.8%), carpooled (10.9%), walked to work (1.6%), public transportation (0.8%), worked from home (3.9%)
Jeffrey Beall from Colorado, USA // Wikimedia Commons
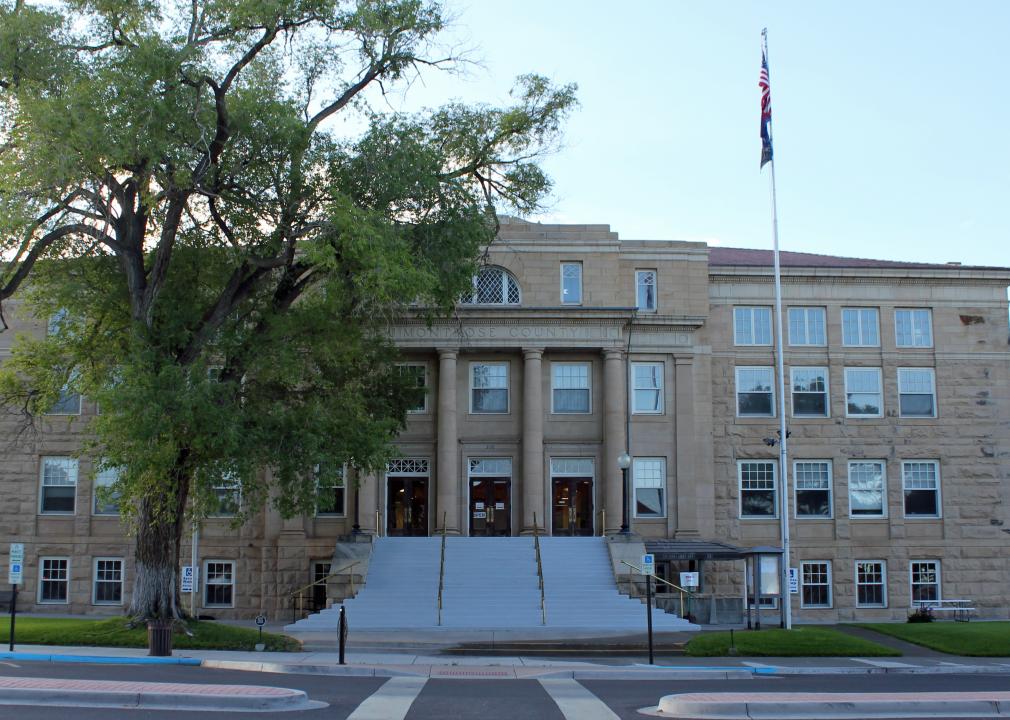
#24. Montrose County
– Workers with 90+ minute commute: 2.7%
— 60+ minute commute: 6.3%
– Average commute time: 19 minutes
— 6.8 minutes shorter than state average
– Left for work from 12 a.m. to 6 a.m.: 13.1%
– Worked outside county of residence: 12.7%
– Means of transportation: drove alone (77.5%), carpooled (10.2%), walked to work (2.4%), public transportation (0.5%), worked from home (8.1%)
Milan Suvajac // Wikimedia Commons
#23. Archuleta County
– Workers with 90+ minute commute: 2.8%
— 60+ minute commute: 8.3%
– Average commute time: 20.6 minutes
— 5.2 minutes shorter than state average
– Left for work from 12 a.m. to 6 a.m.: 5.5%
– Worked outside county of residence: 7.3%
– Means of transportation: drove alone (70.4%), carpooled (11.7%), walked to work (3.0%), public transportation (0.1%), worked from home (13.5%)
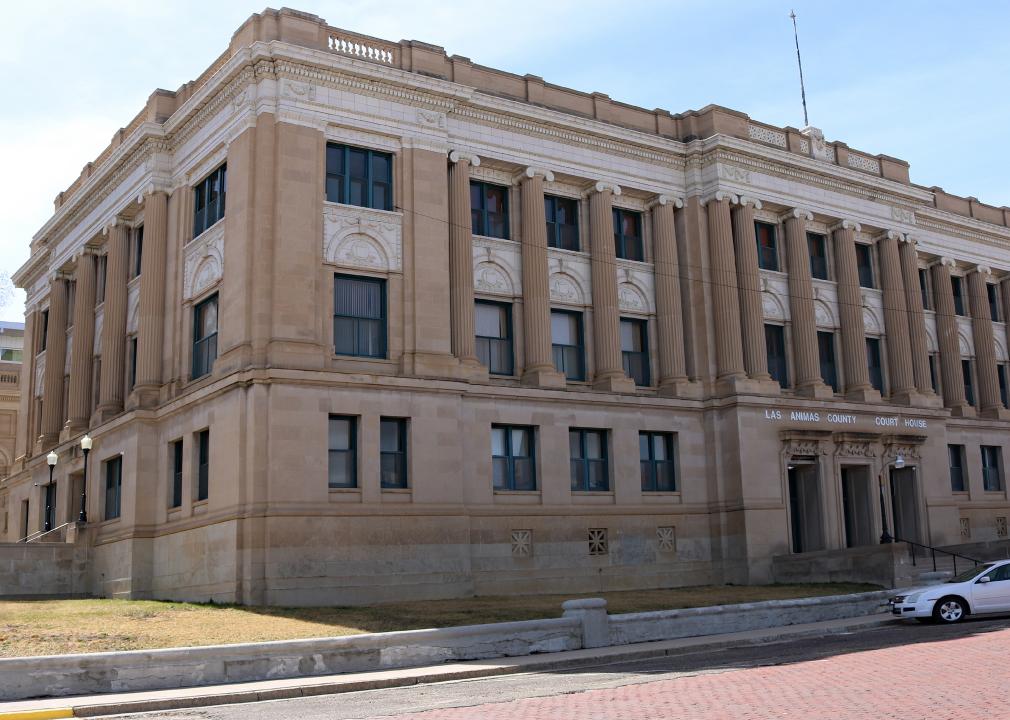
Jeffrey Beall // Wikimedia Commons
#22. Las Animas County
– Workers with 90+ minute commute: 3.1%
— 60+ minute commute: 6.9%
– Average commute time: 19 minutes
— 6.8 minutes shorter than state average
– Left for work from 12 a.m. to 6 a.m.: 11.4%
– Worked outside county of residence: 4.3%
– Means of transportation: drove alone (68.9%), carpooled (15.8%), walked to work (4.4%), public transportation (0.6%), worked from home (8.0%)
Acutemi // Wikimedia Commons
#21. Logan County
– Workers with 90+ minute commute: 3.2%
— 60+ minute commute: 5.1%
– Average commute time: 17 minutes
— 8.8 minutes shorter than state average
– Left for work from 12 a.m. to 6 a.m.: 17.0%
– Worked outside county of residence: 10.2%
– Means of transportation: drove alone (73.0%), carpooled (12.3%), walked to work (3.5%), public transportation (2.6%), worked from home (7.8%)
You may also like: Cities in Colorado with the most living in poverty
Jeffrey Beall // Wikimedia Commons
#20. Gilpin County
– Workers with 90+ minute commute: 3.4%
— 60+ minute commute: 29.5%
– Average commute time: 38.4 minutes
— 12.6 minutes longer than state average
– Left for work from 12 a.m. to 6 a.m.: 16.9%
– Worked outside county of residence: 51.4%
– Means of transportation: drove alone (73.1%), carpooled (9.3%), walked to work (1.3%), public transportation (0.7%), worked from home (15.2%)
Jeffrey Beall // Wikimedia Commons
#19. Costilla County
– Workers with 90+ minute commute: 3.5%
— 60+ minute commute: 5.4%
– Average commute time: 23.9 minutes
— 1.9 minutes shorter than state average
– Left for work from 12 a.m. to 6 a.m.: 2.1%
– Worked outside county of residence: 33.5%
– Means of transportation: drove alone (65.7%), carpooled (23.5%), walked to work (4.6%), public transportation (0.0%), worked from home (6.2%)
Jeffrey Beall // Wikimedia Commons
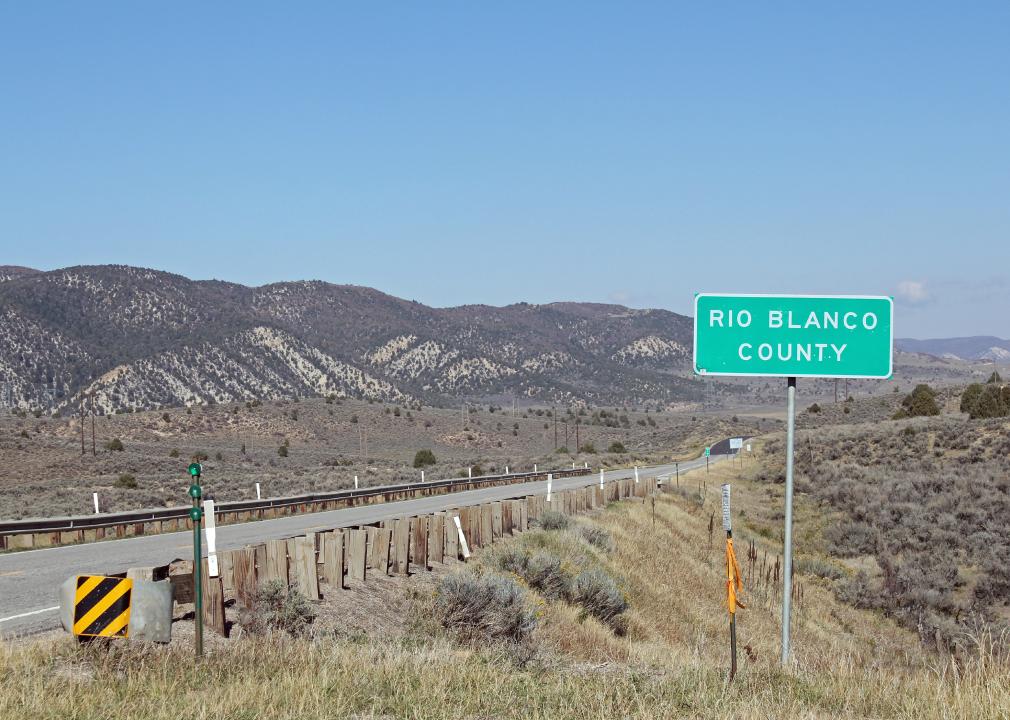
#18. Rio Blanco County
– Workers with 90+ minute commute: 3.5%
— 60+ minute commute: 6.7%
– Average commute time: 15.3 minutes
— 10.5 minutes shorter than state average
– Left for work from 12 a.m. to 6 a.m.: 17.2%
– Worked outside county of residence: 5.0%
– Means of transportation: drove alone (75.4%), carpooled (11.5%), walked to work (4.9%), public transportation (0.4%), worked from home (5.9%)
Jeffrey Beall // Wikimedia Commons
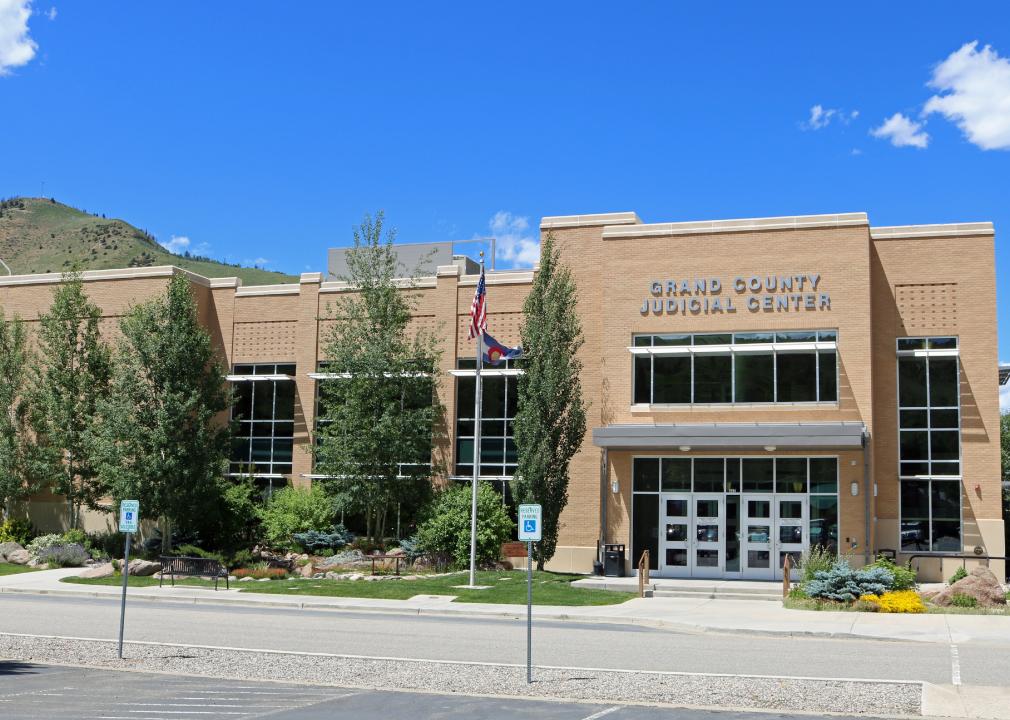
#17. Grand County
– Workers with 90+ minute commute: 3.7%
— 60+ minute commute: 6.8%
– Average commute time: 24.6 minutes
— 1.2 minutes shorter than state average
– Left for work from 12 a.m. to 6 a.m.: 12.6%
– Worked outside county of residence: 10.1%
– Means of transportation: drove alone (66.3%), carpooled (8.1%), walked to work (5.7%), public transportation (3.7%), worked from home (14.5%)
Ammodramus // Wikimedia Commons
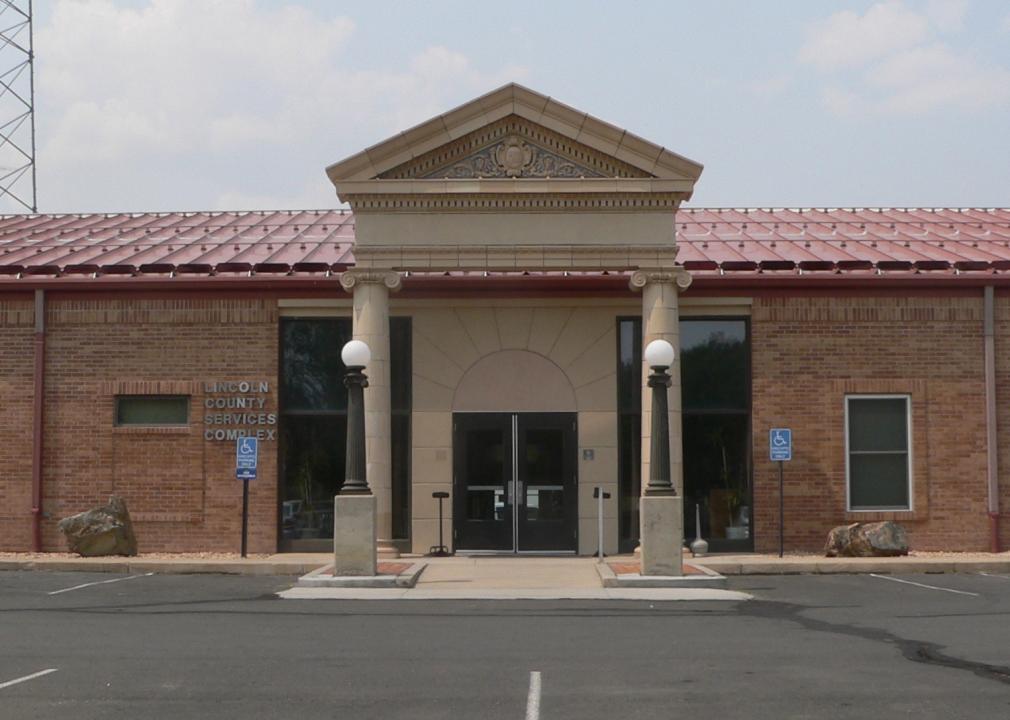
#16. Lincoln County
– Workers with 90+ minute commute: 3.8%
— 60+ minute commute: 9.2%
– Average commute time: 17.1 minutes
— 8.7 minutes shorter than state average
– Left for work from 12 a.m. to 6 a.m.: 10.0%
– Worked outside county of residence: 11.4%
– Means of transportation: drove alone (74.3%), carpooled (11.6%), walked to work (3.5%), public transportation (0.0%), worked from home (8.3%)
You may also like: What Colorado’s immigrant population looked like in 1900
Billy Hathorn // Wikimedia Commons
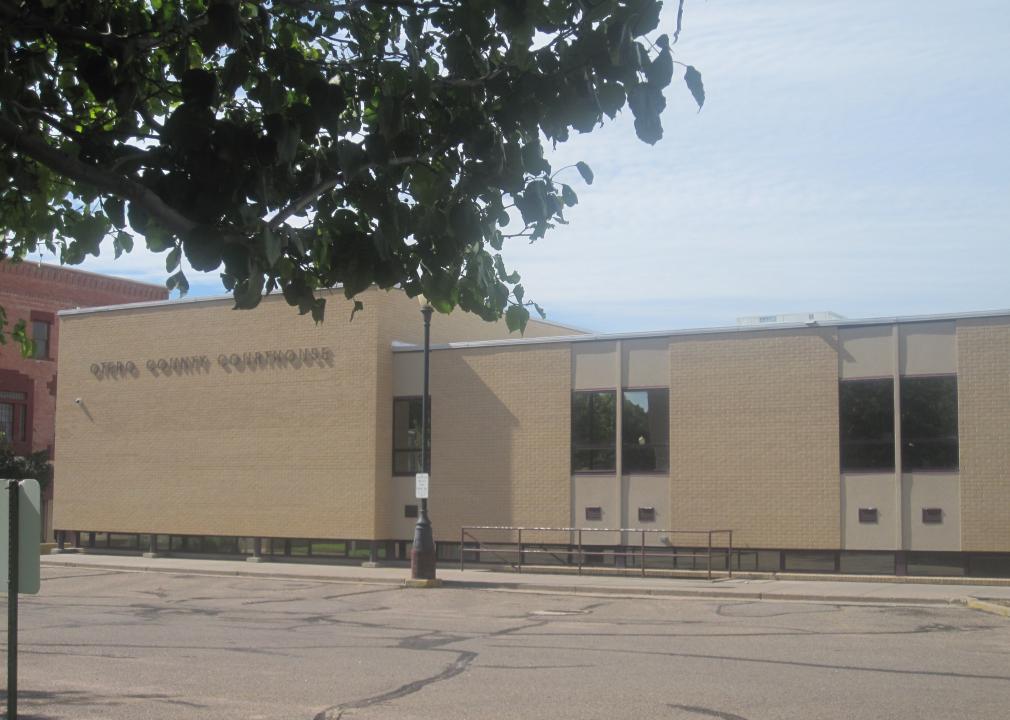
#15. Otero County
– Workers with 90+ minute commute: 3.9%
— 60+ minute commute: 7.3%
– Average commute time: 21.1 minutes
— 4.7 minutes shorter than state average
– Left for work from 12 a.m. to 6 a.m.: 15.8%
– Worked outside county of residence: 15.1%
– Means of transportation: drove alone (77.3%), carpooled (12.8%), walked to work (2.4%), public transportation (0.1%), worked from home (3.9%)
Daniel Schwen // Wikimedia Commons
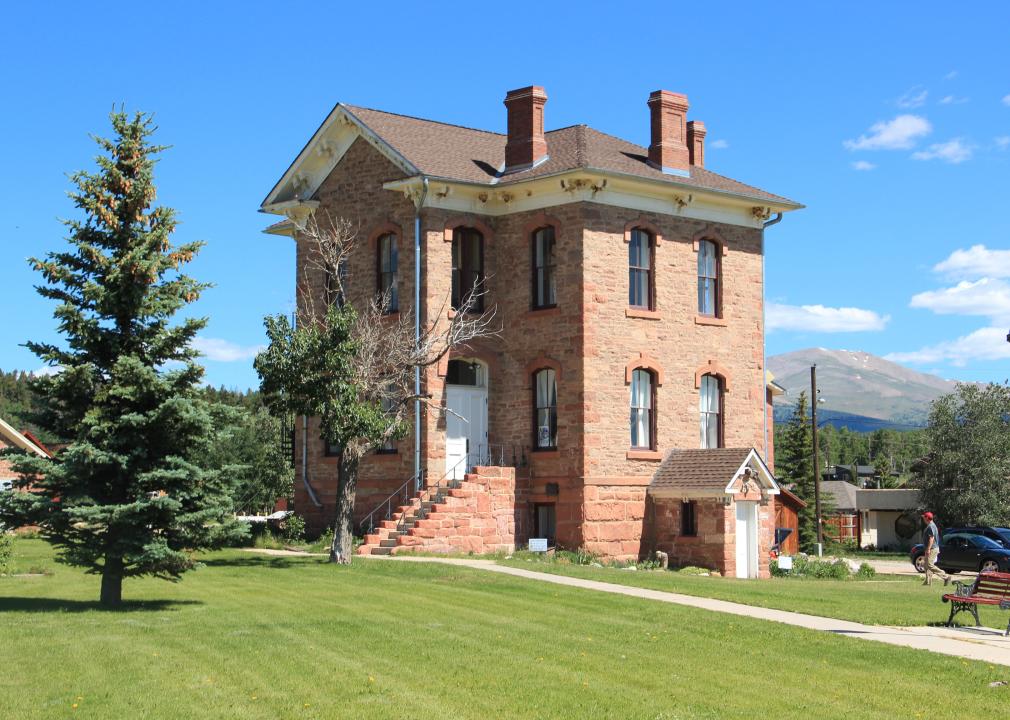
#14. Lake County
– Workers with 90+ minute commute: 4.0%
— 60+ minute commute: 16.3%
– Average commute time: 35.7 minutes
— 9.9 minutes longer than state average
– Left for work from 12 a.m. to 6 a.m.: 17.0%
– Worked outside county of residence: 54.4%
– Means of transportation: drove alone (67.1%), carpooled (18.9%), walked to work (2.0%), public transportation (0.0%), worked from home (6.4%)
Ken Lund from Las Vegas, Nevada, USA // Wikimedia Commons
#13. Ouray County
– Workers with 90+ minute commute: 4.0%
— 60+ minute commute: 14.8%
– Average commute time: 28.6 minutes
— 2.8 minutes longer than state average
– Left for work from 12 a.m. to 6 a.m.: 7.0%
– Worked outside county of residence: 25.1%
– Means of transportation: drove alone (64.8%), carpooled (9.6%), walked to work (6.4%), public transportation (0.0%), worked from home (17.1%)

Jeffrey Beall // Wikimedia Commons
#12. Morgan County
– Workers with 90+ minute commute: 4.0%
— 60+ minute commute: 7.8%
– Average commute time: 18.7 minutes
— 7.1 minutes shorter than state average
– Left for work from 12 a.m. to 6 a.m.: 24.5%
– Worked outside county of residence: 9.9%
– Means of transportation: drove alone (76.5%), carpooled (15.2%), walked to work (1.6%), public transportation (0.1%), worked from home (5.8%)
Jeffrey Beall // Wikimedia Commons
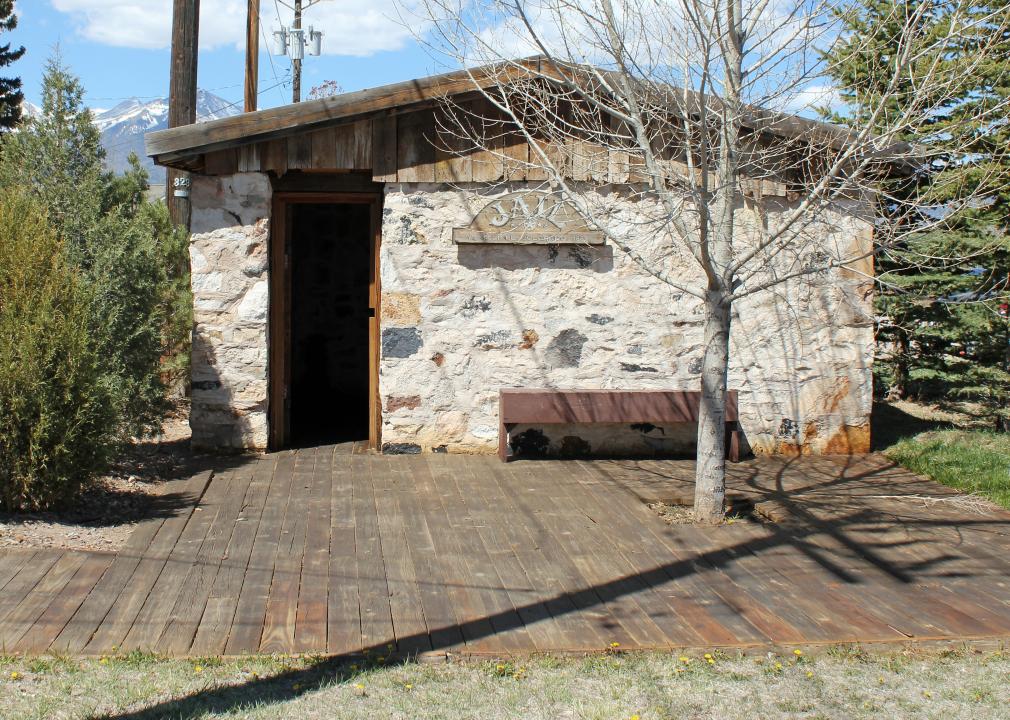
#11. Fremont County
– Workers with 90+ minute commute: 4.1%
— 60+ minute commute: 12.1%
– Average commute time: 25.7 minutes
— 0.1 minutes shorter than state average
– Left for work from 12 a.m. to 6 a.m.: 17.8%
– Worked outside county of residence: 19.5%
– Means of transportation: drove alone (79.2%), carpooled (9.8%), walked to work (1.3%), public transportation (0.1%), worked from home (8.6%)
You may also like: Highest NFL draft picks from Colorado
Jeffrey Beall // Wikimedia Commons
#10. Chaffee County
– Workers with 90+ minute commute: 4.7%
— 60+ minute commute: 6.3%
– Average commute time: 18.8 minutes
— 7.0 minutes shorter than state average
– Left for work from 12 a.m. to 6 a.m.: 9.9%
– Worked outside county of residence: 6.8%
– Means of transportation: drove alone (67.7%), carpooled (8.4%), walked to work (5.1%), public transportation (0.5%), worked from home (13.5%)
Calvin Beale // Wikimedia Commons
#9. Sedgwick County
– Workers with 90+ minute commute: 5.1%
— 60+ minute commute: 8.1%
– Average commute time: 21.5 minutes
— 4.3 minutes shorter than state average
– Left for work from 12 a.m. to 6 a.m.: 21.7%
– Worked outside county of residence: 9.4%
– Means of transportation: drove alone (71.2%), carpooled (12.0%), walked to work (6.7%), public transportation (0.0%), worked from home (8.7%)
Jeffrey Beall // Wikimedia Commons
#8. Washington County
– Workers with 90+ minute commute: 5.2%
— 60+ minute commute: 9.4%
– Average commute time: 23.7 minutes
— 2.1 minutes shorter than state average
– Left for work from 12 a.m. to 6 a.m.: 13.7%
– Worked outside county of residence: 31.6%
– Means of transportation: drove alone (71.0%), carpooled (11.8%), walked to work (4.6%), public transportation (0.0%), worked from home (11.6%)
JERRYE AND ROY KLOTZ MD // Wikimedia Commons
#7. San Juan County
– Workers with 90+ minute commute: 5.5%
— 60+ minute commute: 7.2%
– Average commute time: 14.8 minutes
— 11.0 minutes shorter than state average
– Left for work from 12 a.m. to 6 a.m.: 16.8%
– Worked outside county of residence: 8.9%
– Means of transportation: drove alone (57.4%), carpooled (5.4%), walked to work (18.2%), public transportation (0.0%), worked from home (13.1%)

Originalgum // Wikimedia Commons
#6. Delta County
– Workers with 90+ minute commute: 5.5%
— 60+ minute commute: 15.0%
– Average commute time: 29 minutes
— 3.2 minutes longer than state average
– Left for work from 12 a.m. to 6 a.m.: 21.3%
– Worked outside county of residence: 25.8%
– Means of transportation: drove alone (72.0%), carpooled (12.8%), walked to work (3.0%), public transportation (0.6%), worked from home (10.9%)
You may also like: Most popular baby names for girls of the last decade in Colorado
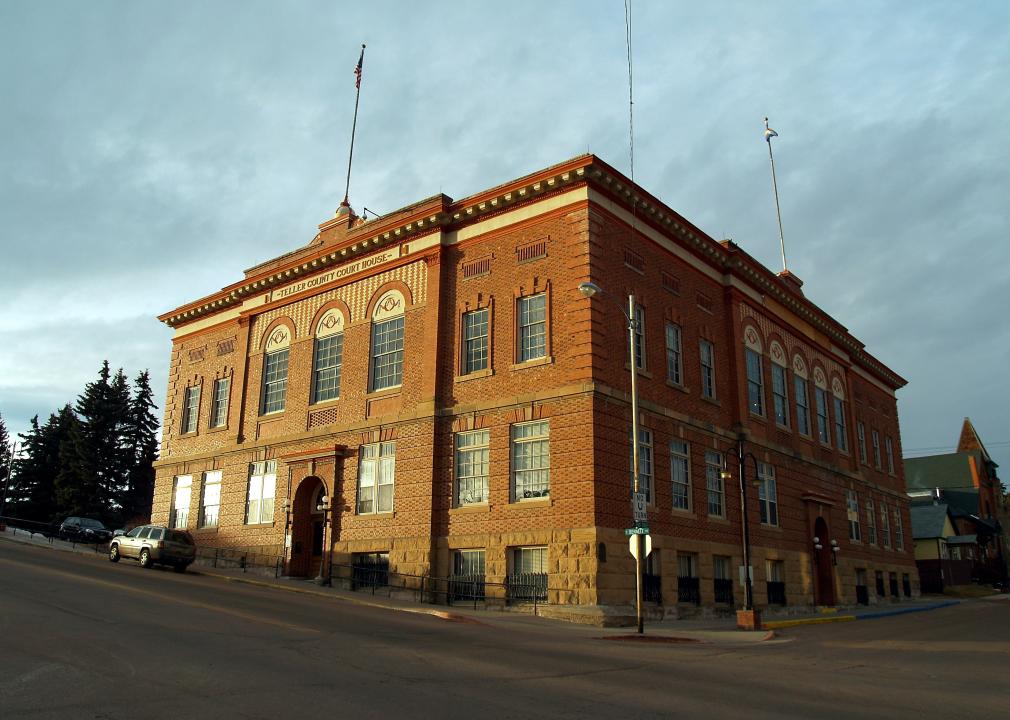
David Shankbone // Wikimedia Commons
#5. Teller County
– Workers with 90+ minute commute: 5.6%
— 60+ minute commute: 14.5%
– Average commute time: 33.4 minutes
— 7.6 minutes longer than state average
– Left for work from 12 a.m. to 6 a.m.: 16.4%
– Worked outside county of residence: 34.5%
– Means of transportation: drove alone (74.3%), carpooled (10.4%), walked to work (2.3%), public transportation (0.0%), worked from home (11.9%)
Jeffrey Beall // Wikimedia Commons
#4. Custer County
– Workers with 90+ minute commute: 5.8%
— 60+ minute commute: 19.3%
– Average commute time: 30.6 minutes
— 4.8 minutes longer than state average
– Left for work from 12 a.m. to 6 a.m.: 1.3%
– Worked outside county of residence: 32.2%
– Means of transportation: drove alone (74.9%), carpooled (2.3%), walked to work (4.2%), public transportation (0.0%), worked from home (18.4%)
Jeffrey Beall // Wikimedia Commons
#3. Elbert County
– Workers with 90+ minute commute: 6.8%
— 60+ minute commute: 23.7%
– Average commute time: 42 minutes
— 16.2 minutes longer than state average
– Left for work from 12 a.m. to 6 a.m.: 19.0%
– Worked outside county of residence: 66.3%
– Means of transportation: drove alone (79.0%), carpooled (7.9%), walked to work (1.2%), public transportation (0.2%), worked from home (10.9%)
GSpics // Wikimedia Commons
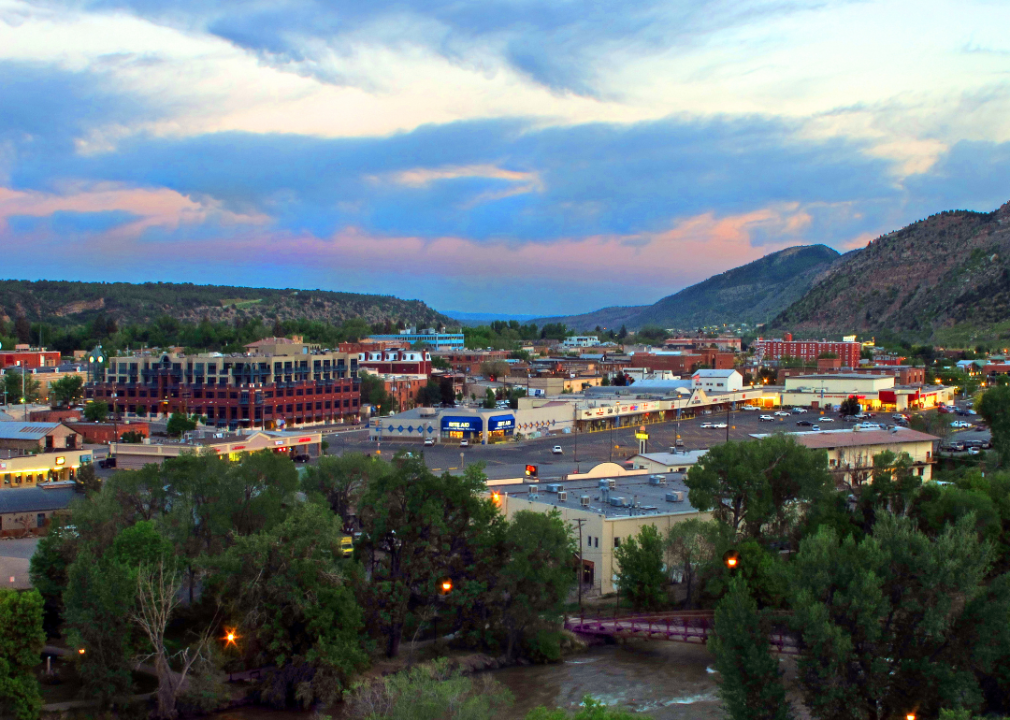
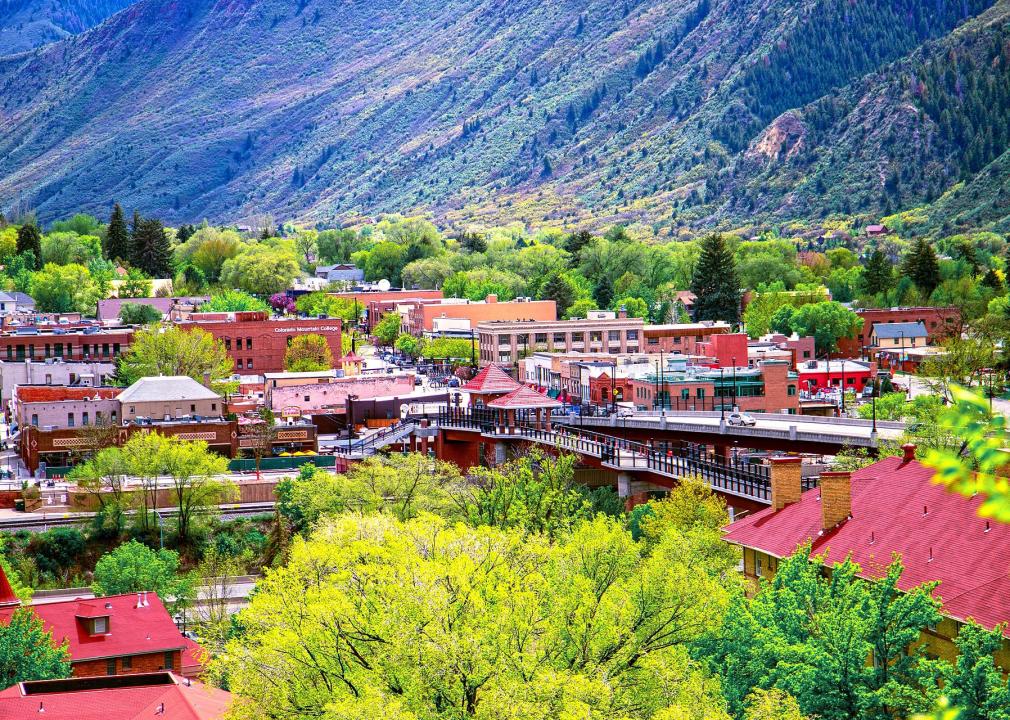
#2. Garfield County
– Workers with 90+ minute commute: 7.0%
— 60+ minute commute: 17.5%
– Average commute time: 31.7 minutes
— 5.9 minutes longer than state average
– Left for work from 12 a.m. to 6 a.m.: 17.0%
– Worked outside county of residence: 23.2%
– Means of transportation: drove alone (67.9%), carpooled (14.0%), walked to work (3.4%), public transportation (3.6%), worked from home (8.2%)
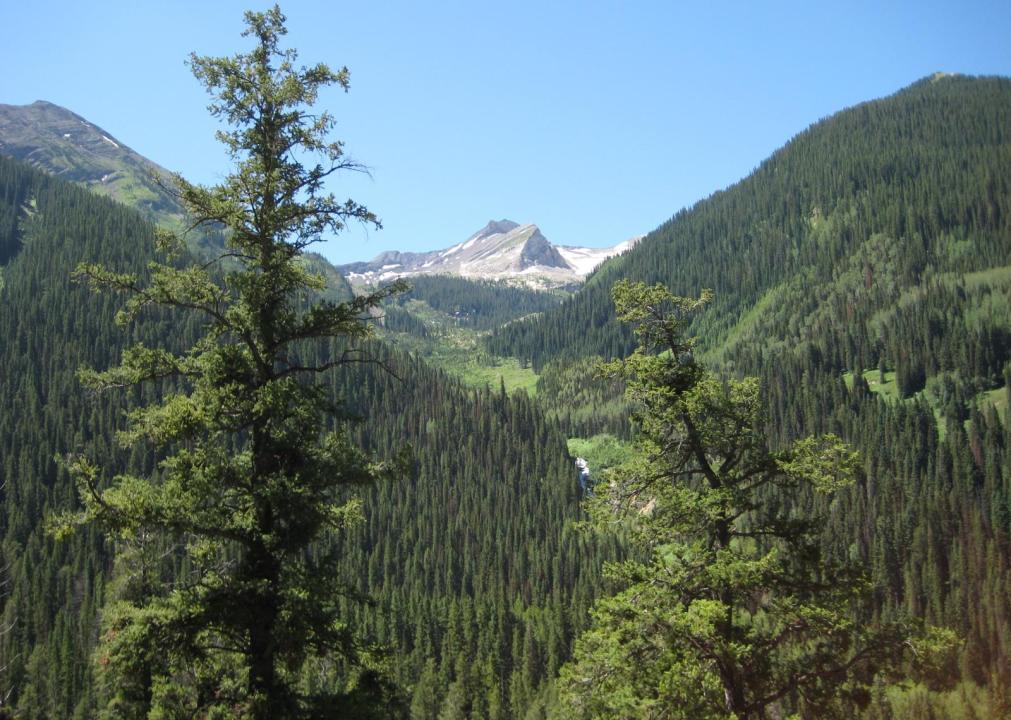
Wusel007 // Wikimedia Commons
#1. Jackson County
– Workers with 90+ minute commute: 7.3%
— 60+ minute commute: 13.1%
– Average commute time: 26 minutes
— 0.2 minutes longer than state average
– Left for work from 12 a.m. to 6 a.m.: 8.2%
– Worked outside county of residence: 7.9%
– Means of transportation: drove alone (52.6%), carpooled (7.4%), walked to work (15.1%), public transportation (0.0%), worked from home (20.5%)
You may also like: Best high schools in Colorado